Duration: Apr-Jul 2022 (3 months)
Prebuilt Charts with Top Saved Queries
- Research
- User Experience
- UI Design
- Prototype
OVERVIEW
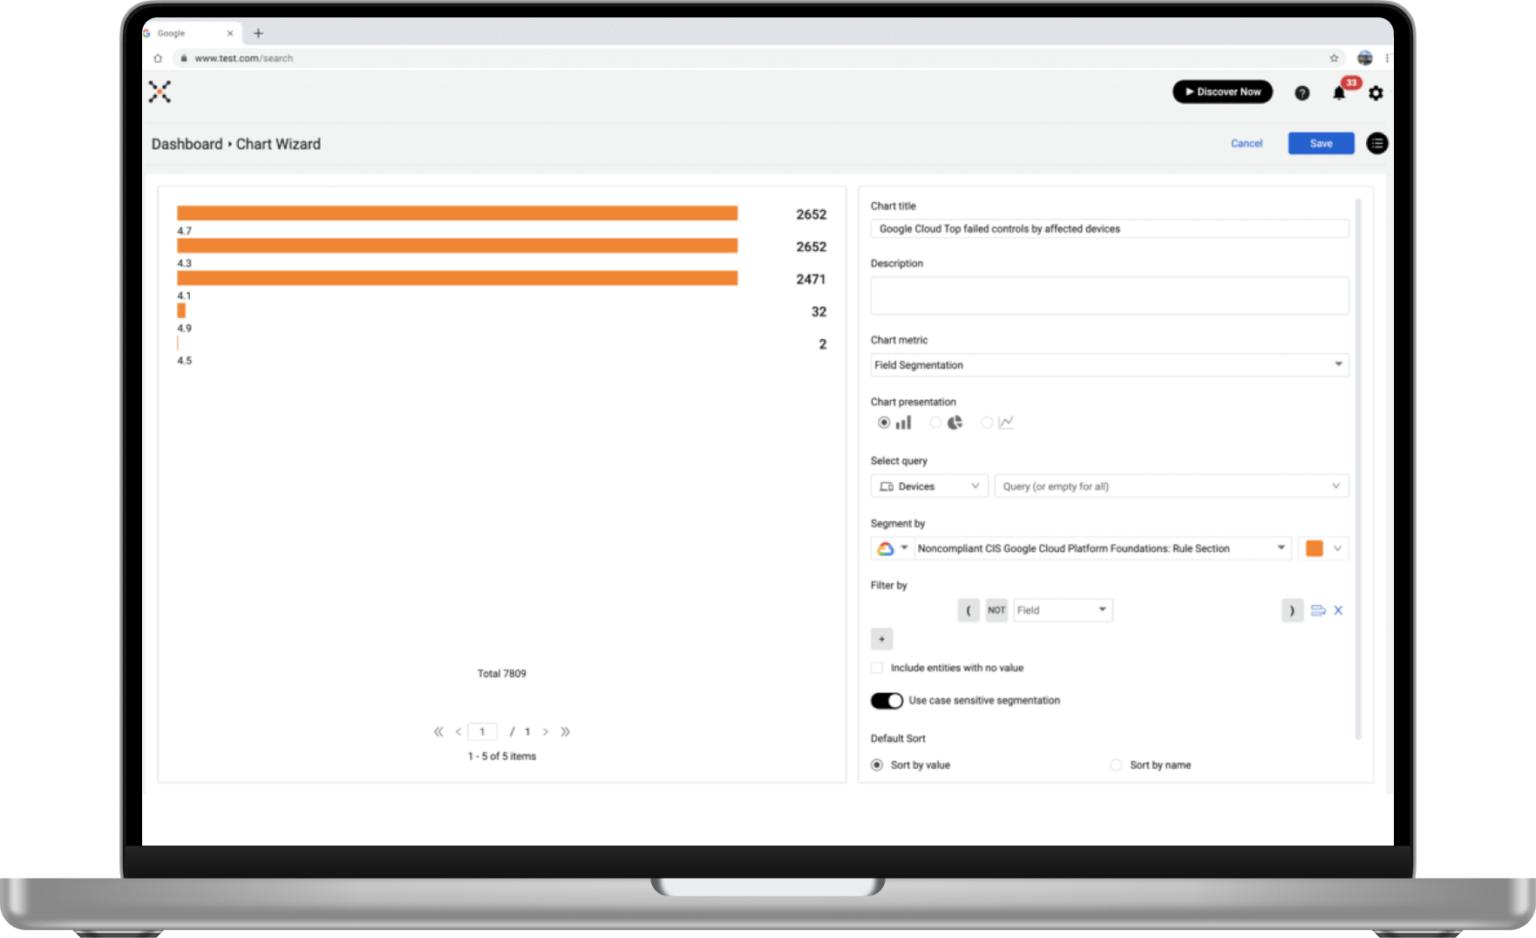
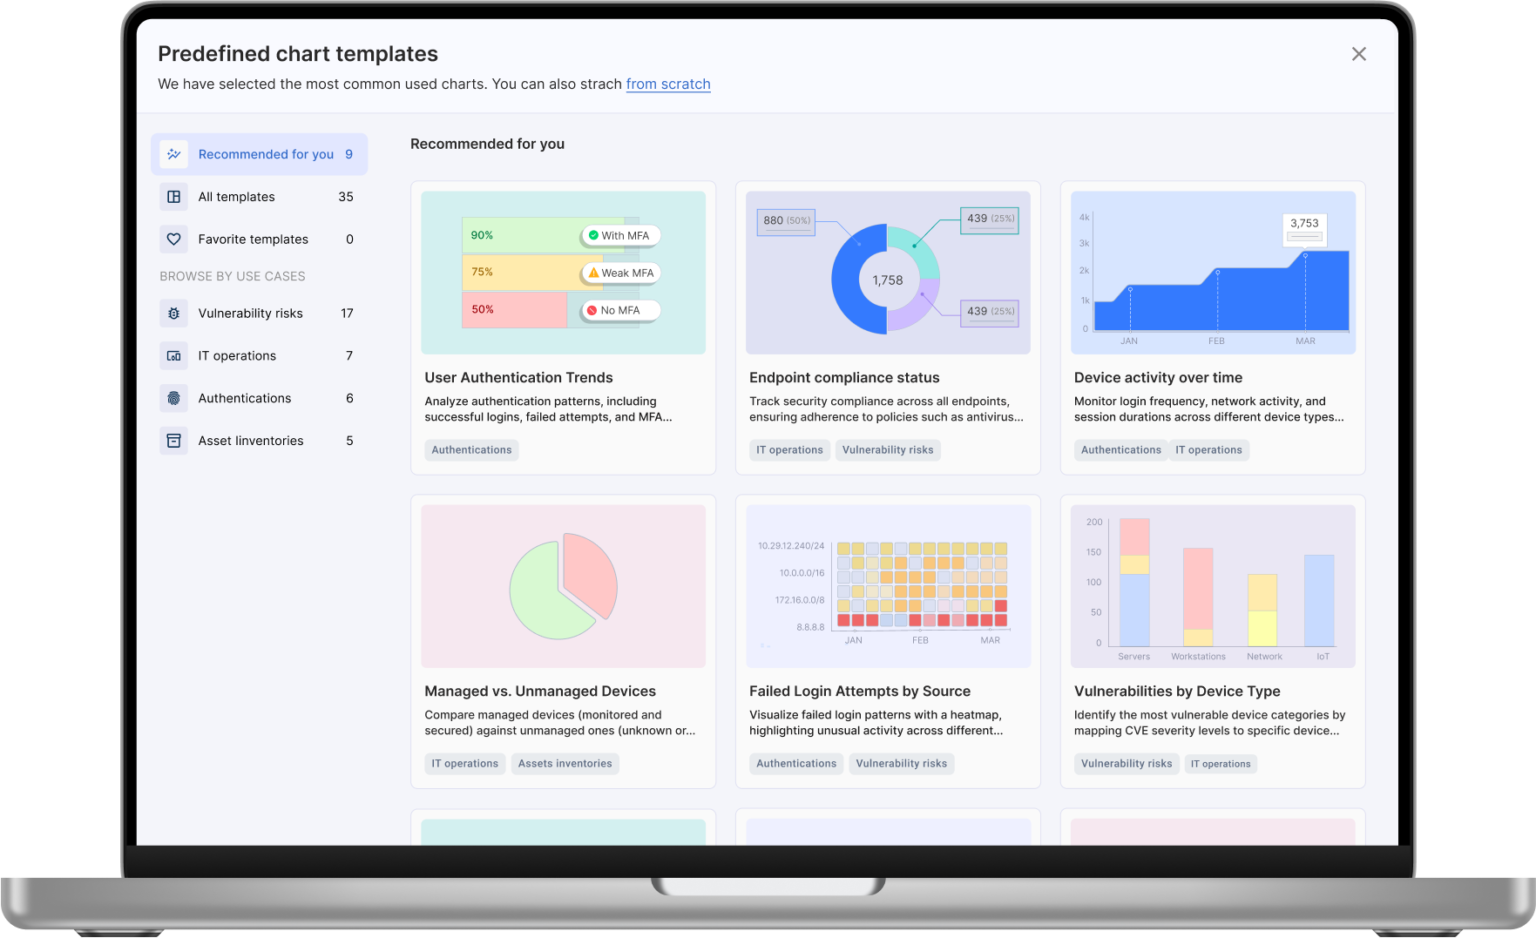
Reducing Onboarding Time by 80% - First-time users of the dashboard often struggle with query-building, delaying their ability to gain insights. This friction significantly impacted time-to-value and user adoption. To address this, we introduced pre-defined chart templates—allowing users to generate meaningful insights with just one click.
TEAM & TIMELINE
I collaborated with:
Scratch to Development: 3 months.
PROBLEM STATEMENT
First-time users were expected to build queries manually without any guidance or shortcuts. This led to:
The result: users were stuck before ever experiencing the value of the platform.
PROCESS
 1. Research & Discovery
Who's using our product, and how are they using data to help their organization?
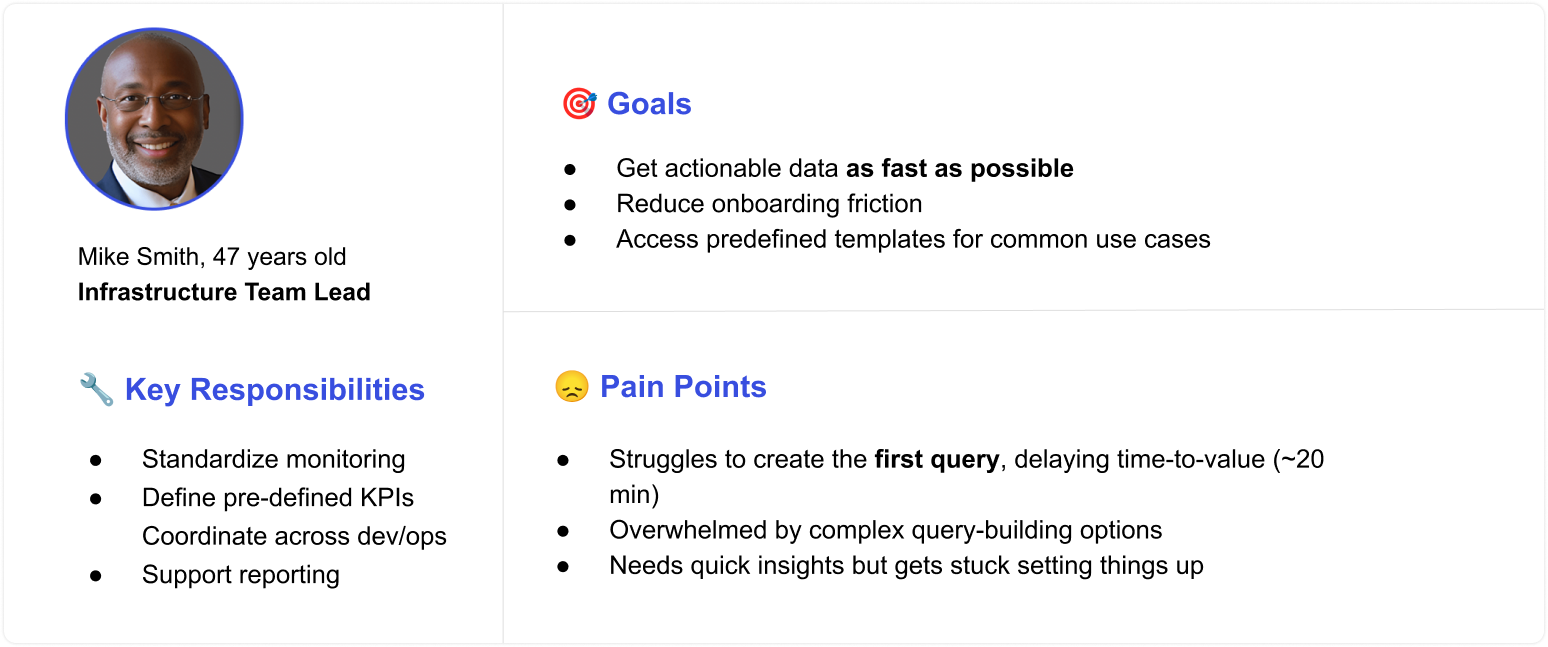
I held meetings with customer success reps and product managers to expand my understanding of our users. After a few sessions, I mapped out a common organizational structure, which helped us define key personas for designing targeted solutions.

Main User Persona
 2. Current Flow
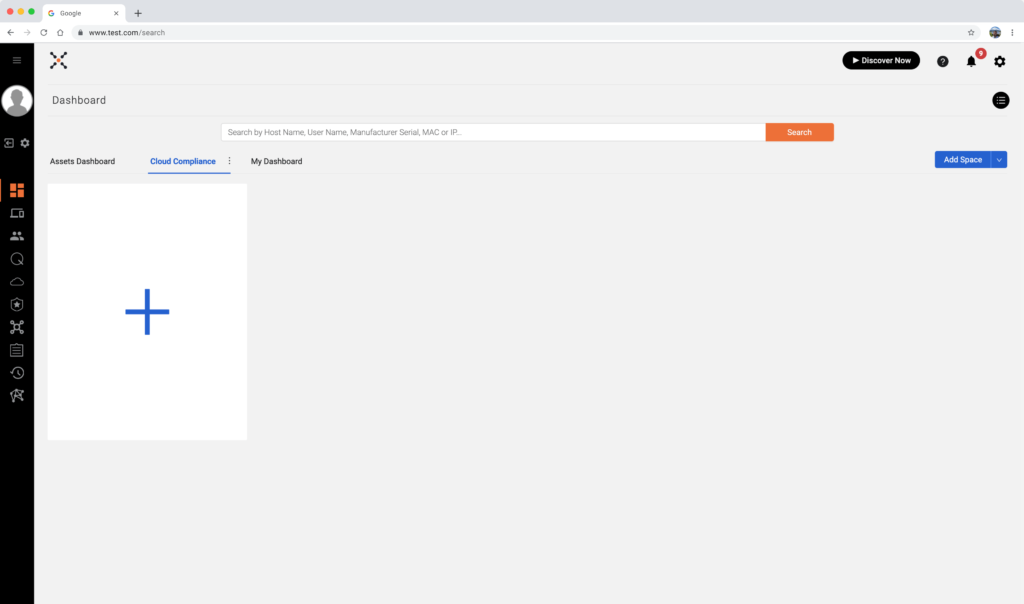
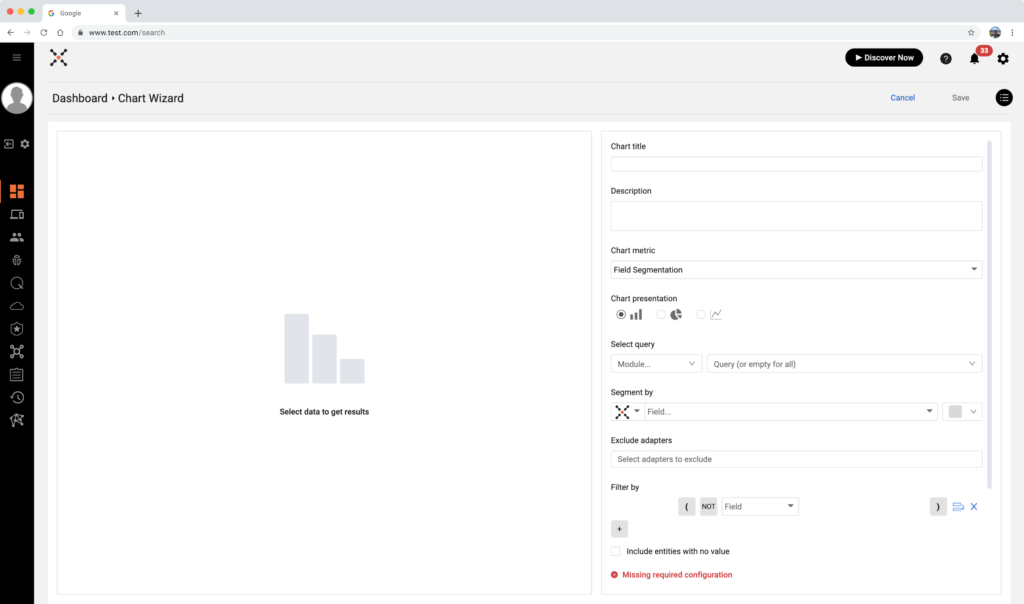
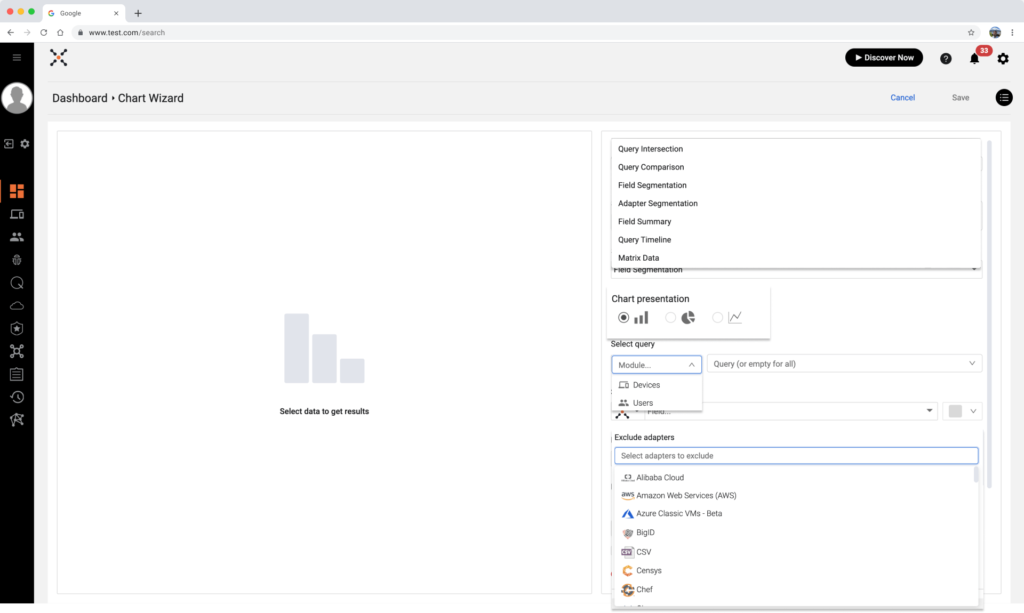
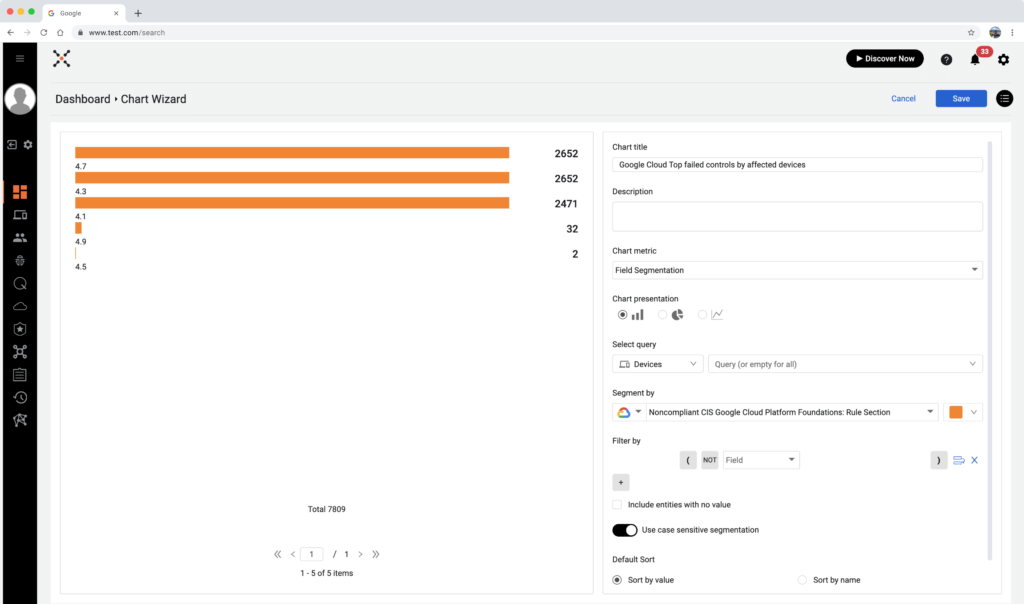
The current user flow to create data is a real “wrench in the works” for the platform, and a strategic, comprehensive problem. It is very hard to navigate, requiring too many steps to create charts of data and dashboards.
Take a look at the following snapshots that represent the user flow at its best. In each step the user has to learn terminology, analyze different chart metrics, deal with overwhelming components, and too many clicks to achieve his goal:
 3. New Flow Diagram
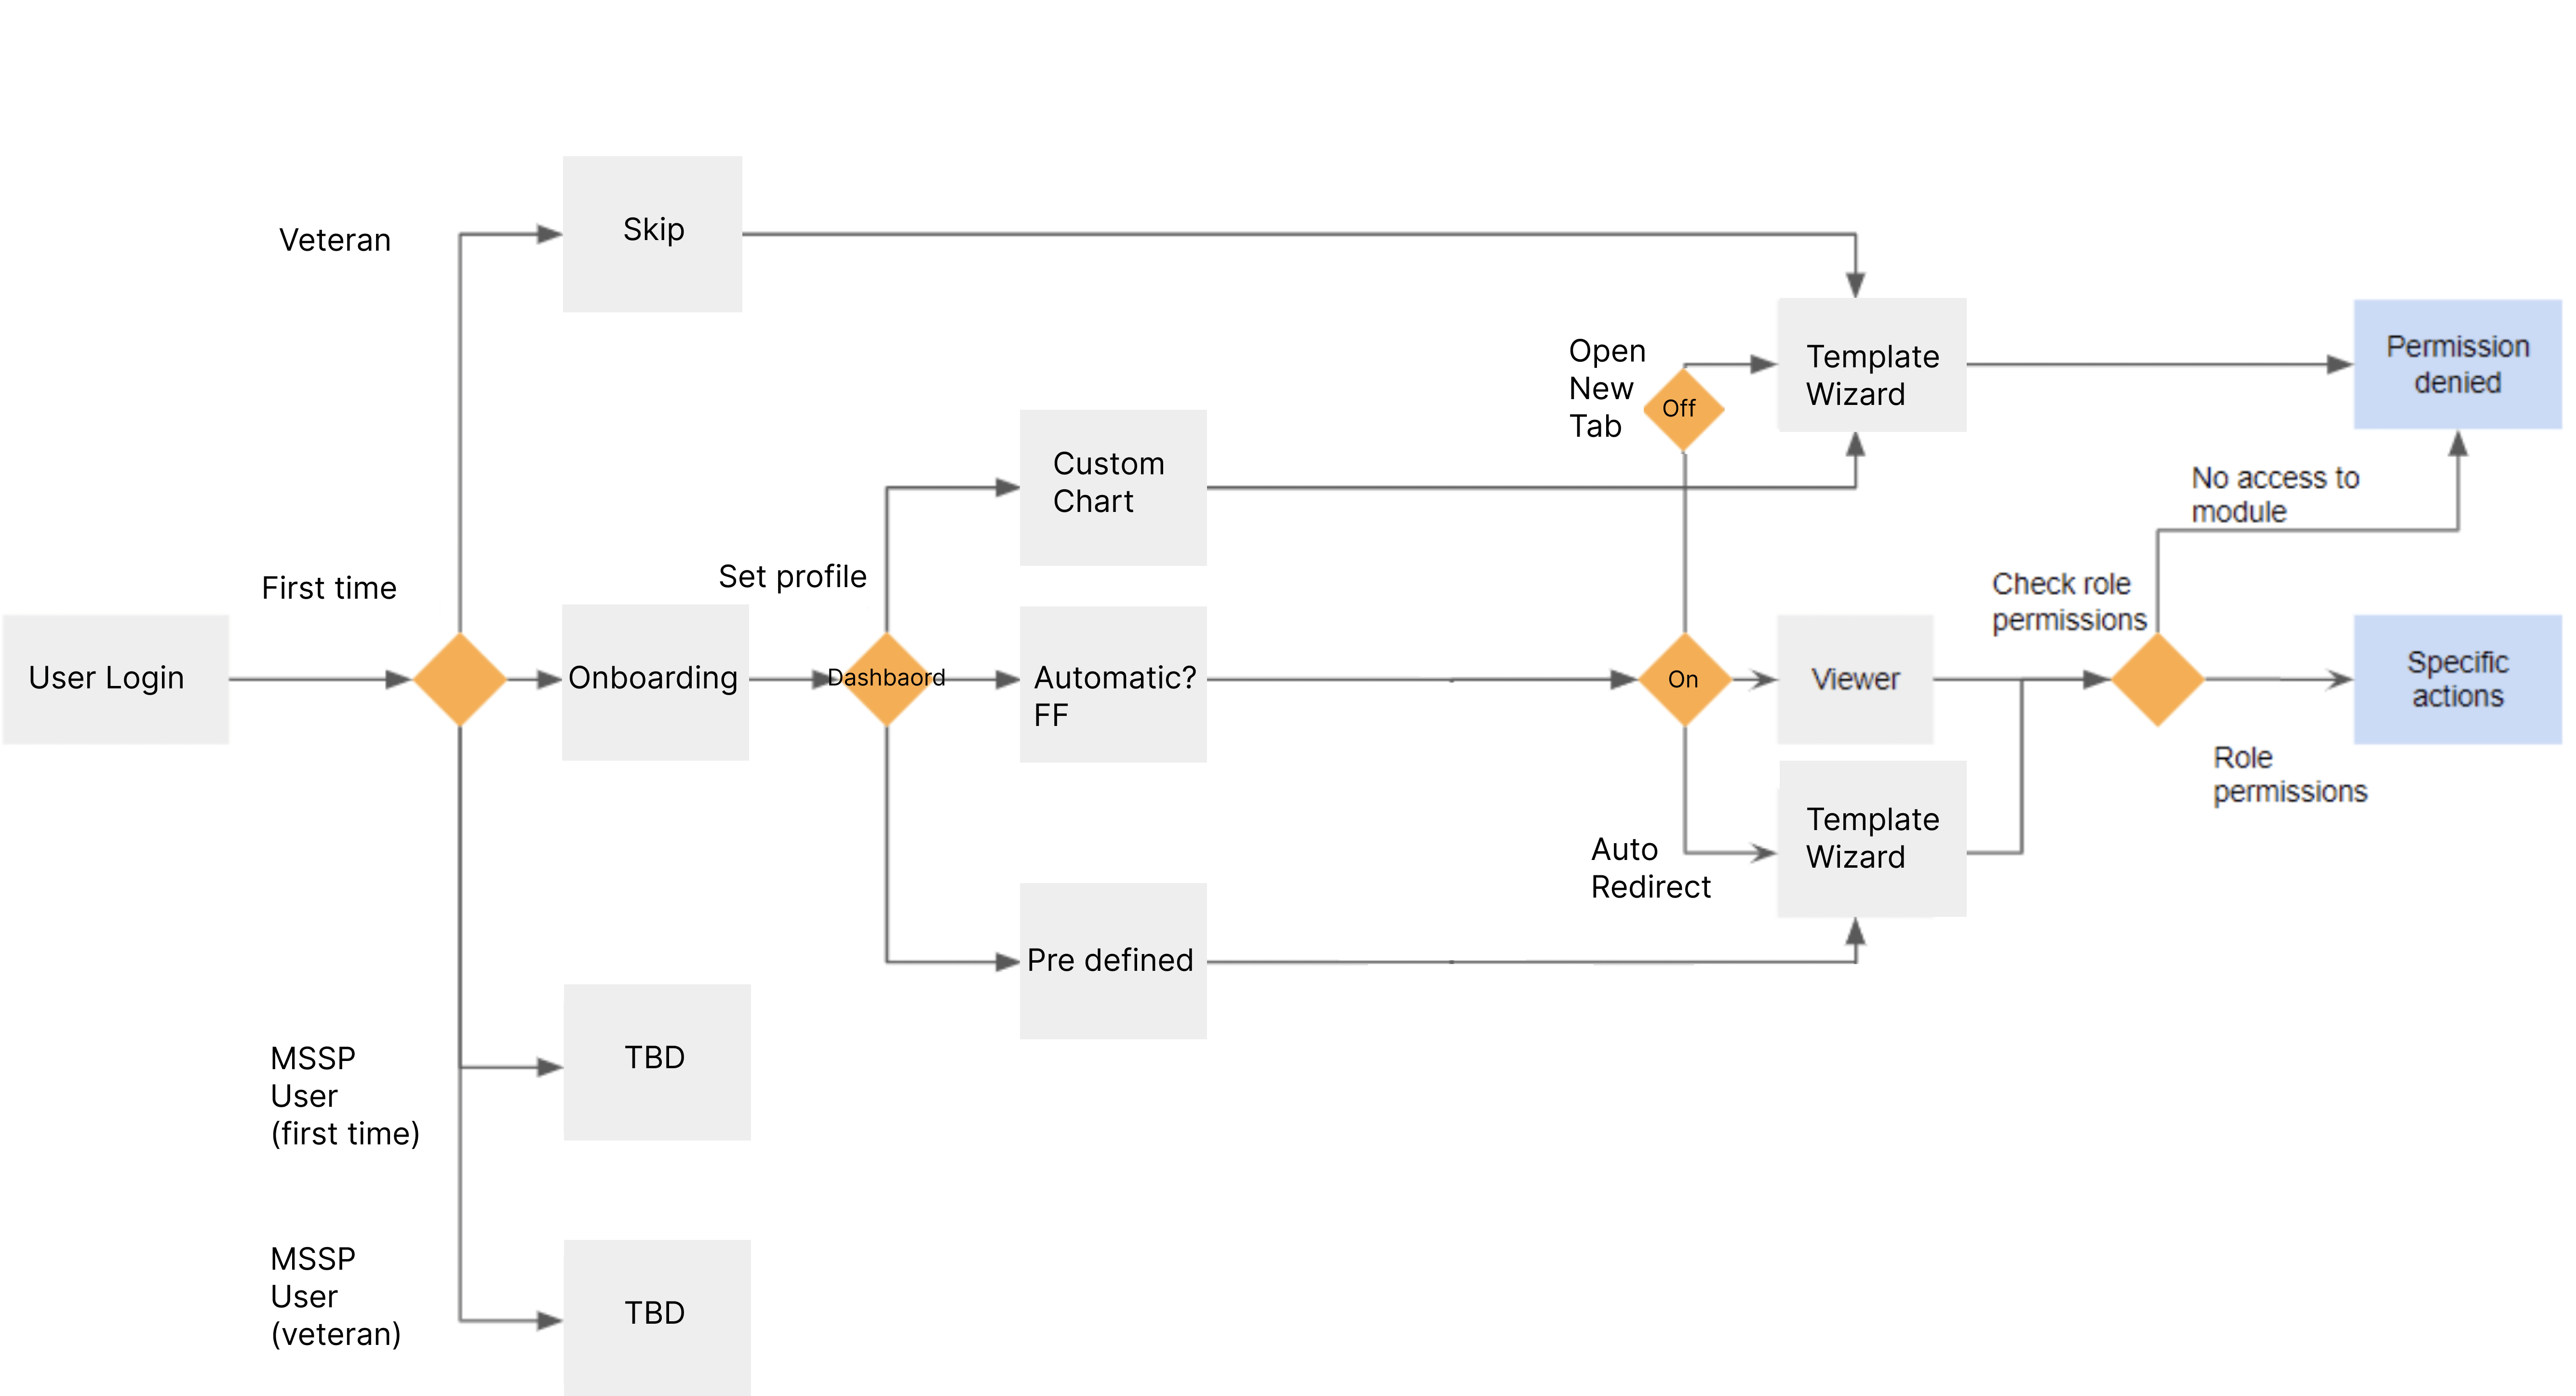
Before getting into more details and visuals, I created a flow diagram that maps all the possible scenarios from the user end:
– First-time or veteran log-in?
– Show onboarding – Yes or No?
It was an interesting and complex task to validate the user’s role and his permission after he logged in and before the option to create new charts of data. I had to meet with the project developer to understand and define the logic and what would happen in the backend. If the user doesn’t have permission to add data, we have to detect it in time and deny him permission to go through the wizard flow.
The Goal - always go through the pre-defined template wizard, no matter if you're a first-time user or a veteran
 4. Vendor Research & Design Inspiration
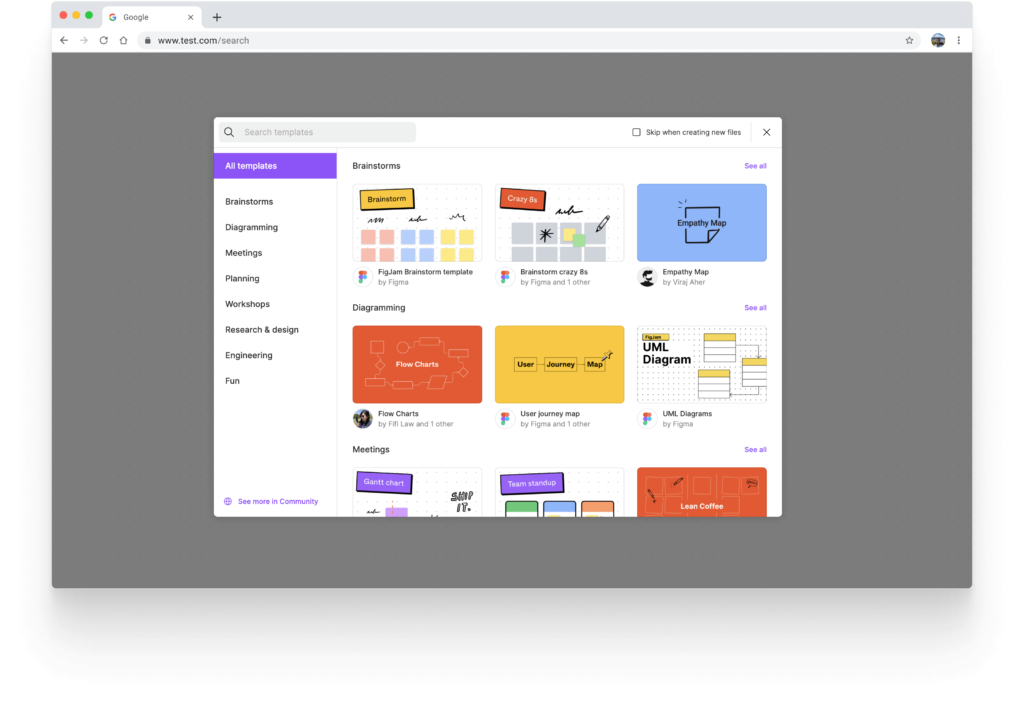
I explored many platforms in our domains and some overlapping domains to get inspiration about how the pre-defined chart wizard should look and behave. As you are going to see, there are clear steps to creating the wizard: Left side with categories, search, etc.… and the focus area (center) where all the chart templates will be placed.

SOLUTION
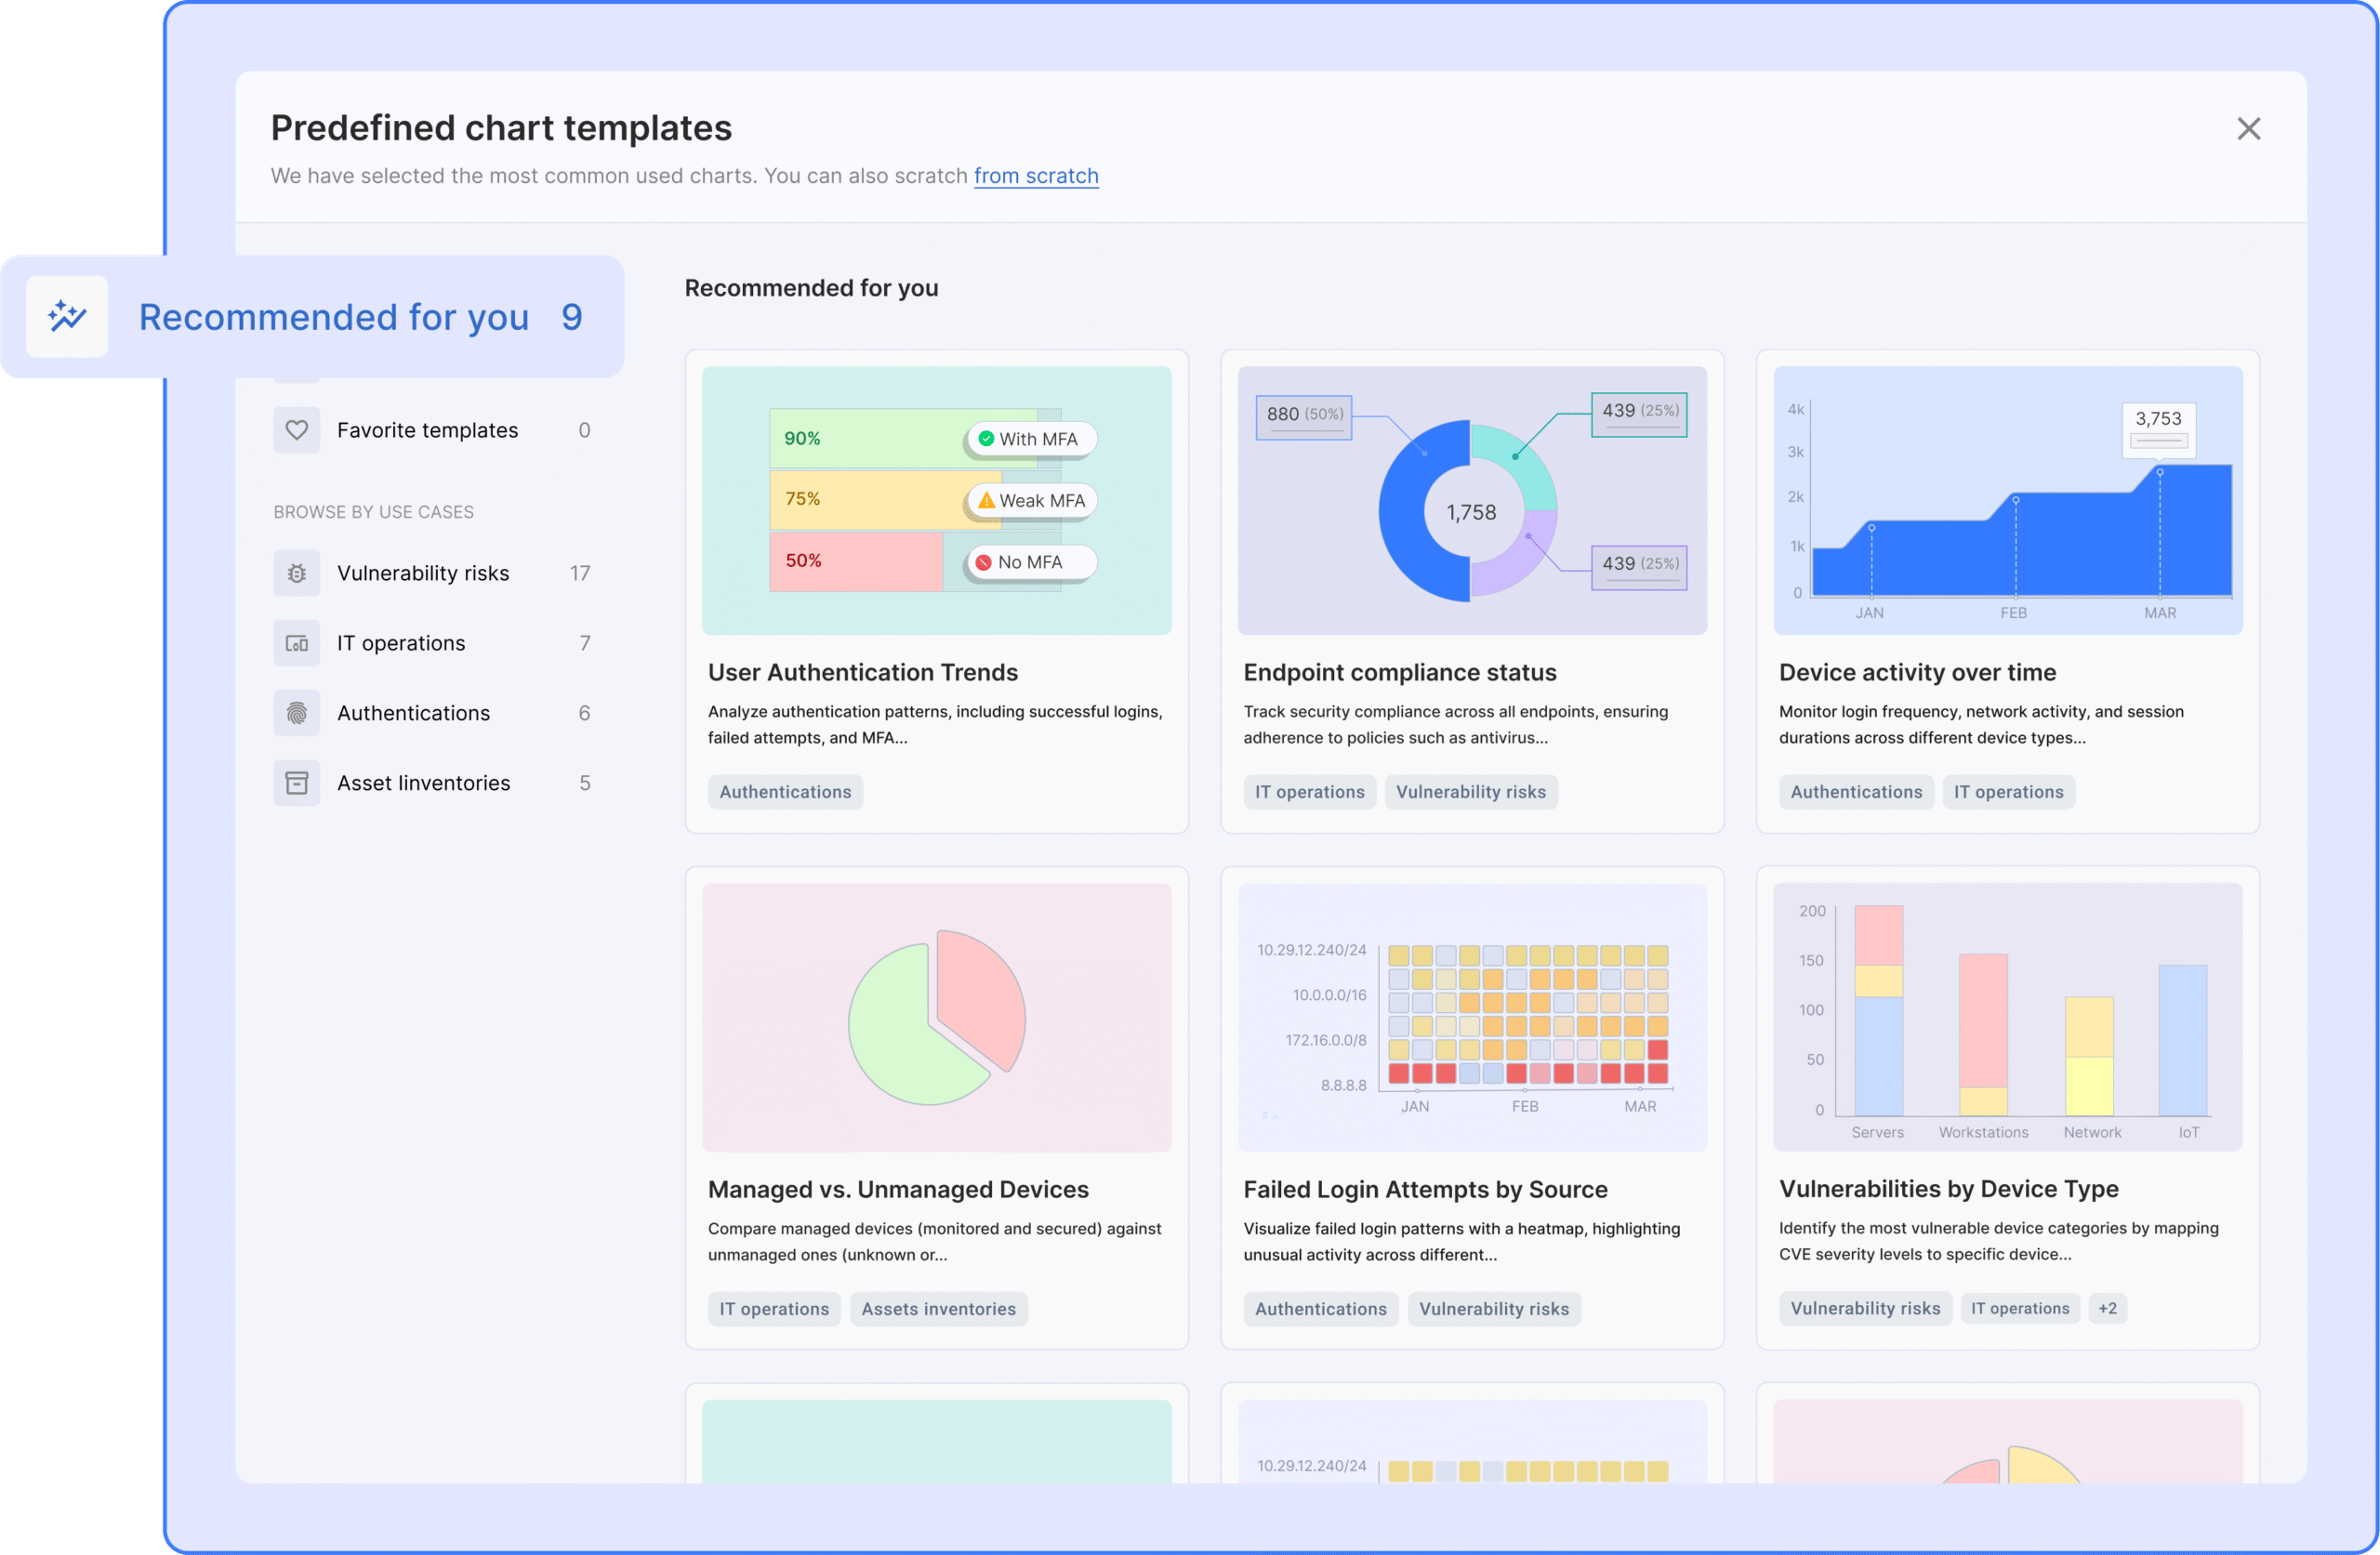
Smart Recommendations
The first page of the flow shows tailored charts for the user’s use case.
Added after the MVP, this feature helped users complete dashboards 75% faster.
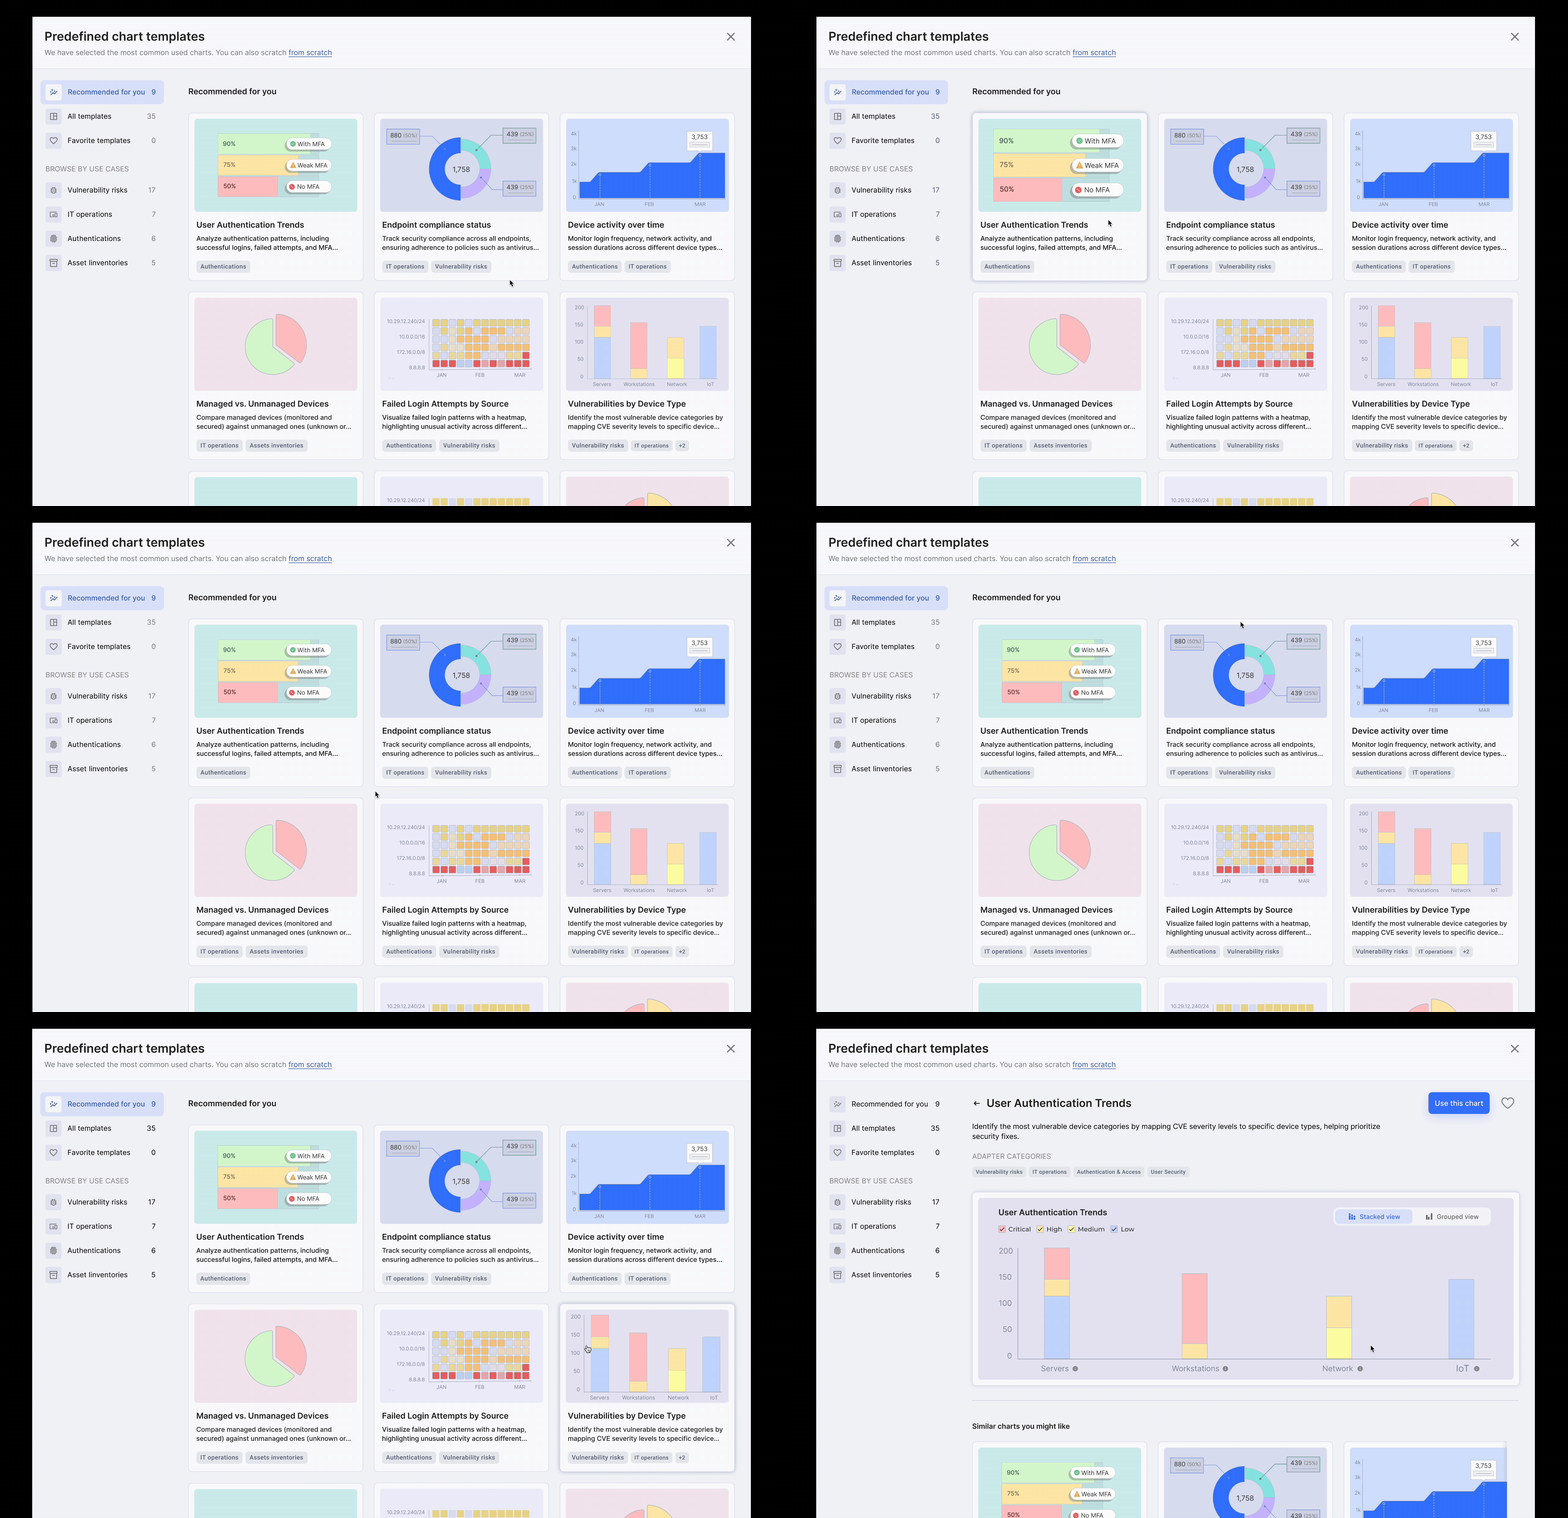
Instant Insights
One-click chart templates let users extract insights immediately, reducing friction and accelerating time-to-value.
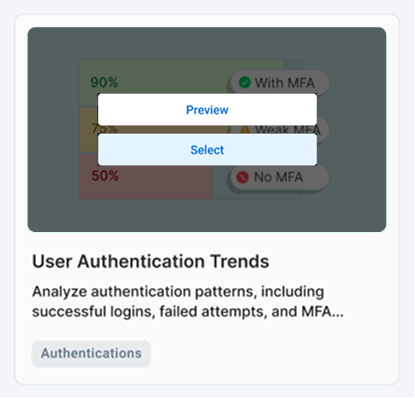
Tile Interaction - 1st Concept
In the first iteration of the “Recommended tailor-made chart templates” section, I explored a hover-based interaction. When users hovered over a chart tile, two options appeared:
– Preview, navigate to a detail page with in-depth metrics and insights
– Select, quickly choose the chart without reviewing details<br/
Based on these insights, I removed the quick-select option and moved the "Select" action to the detail page, simplifying the decision flow and aligning better with user behavior.
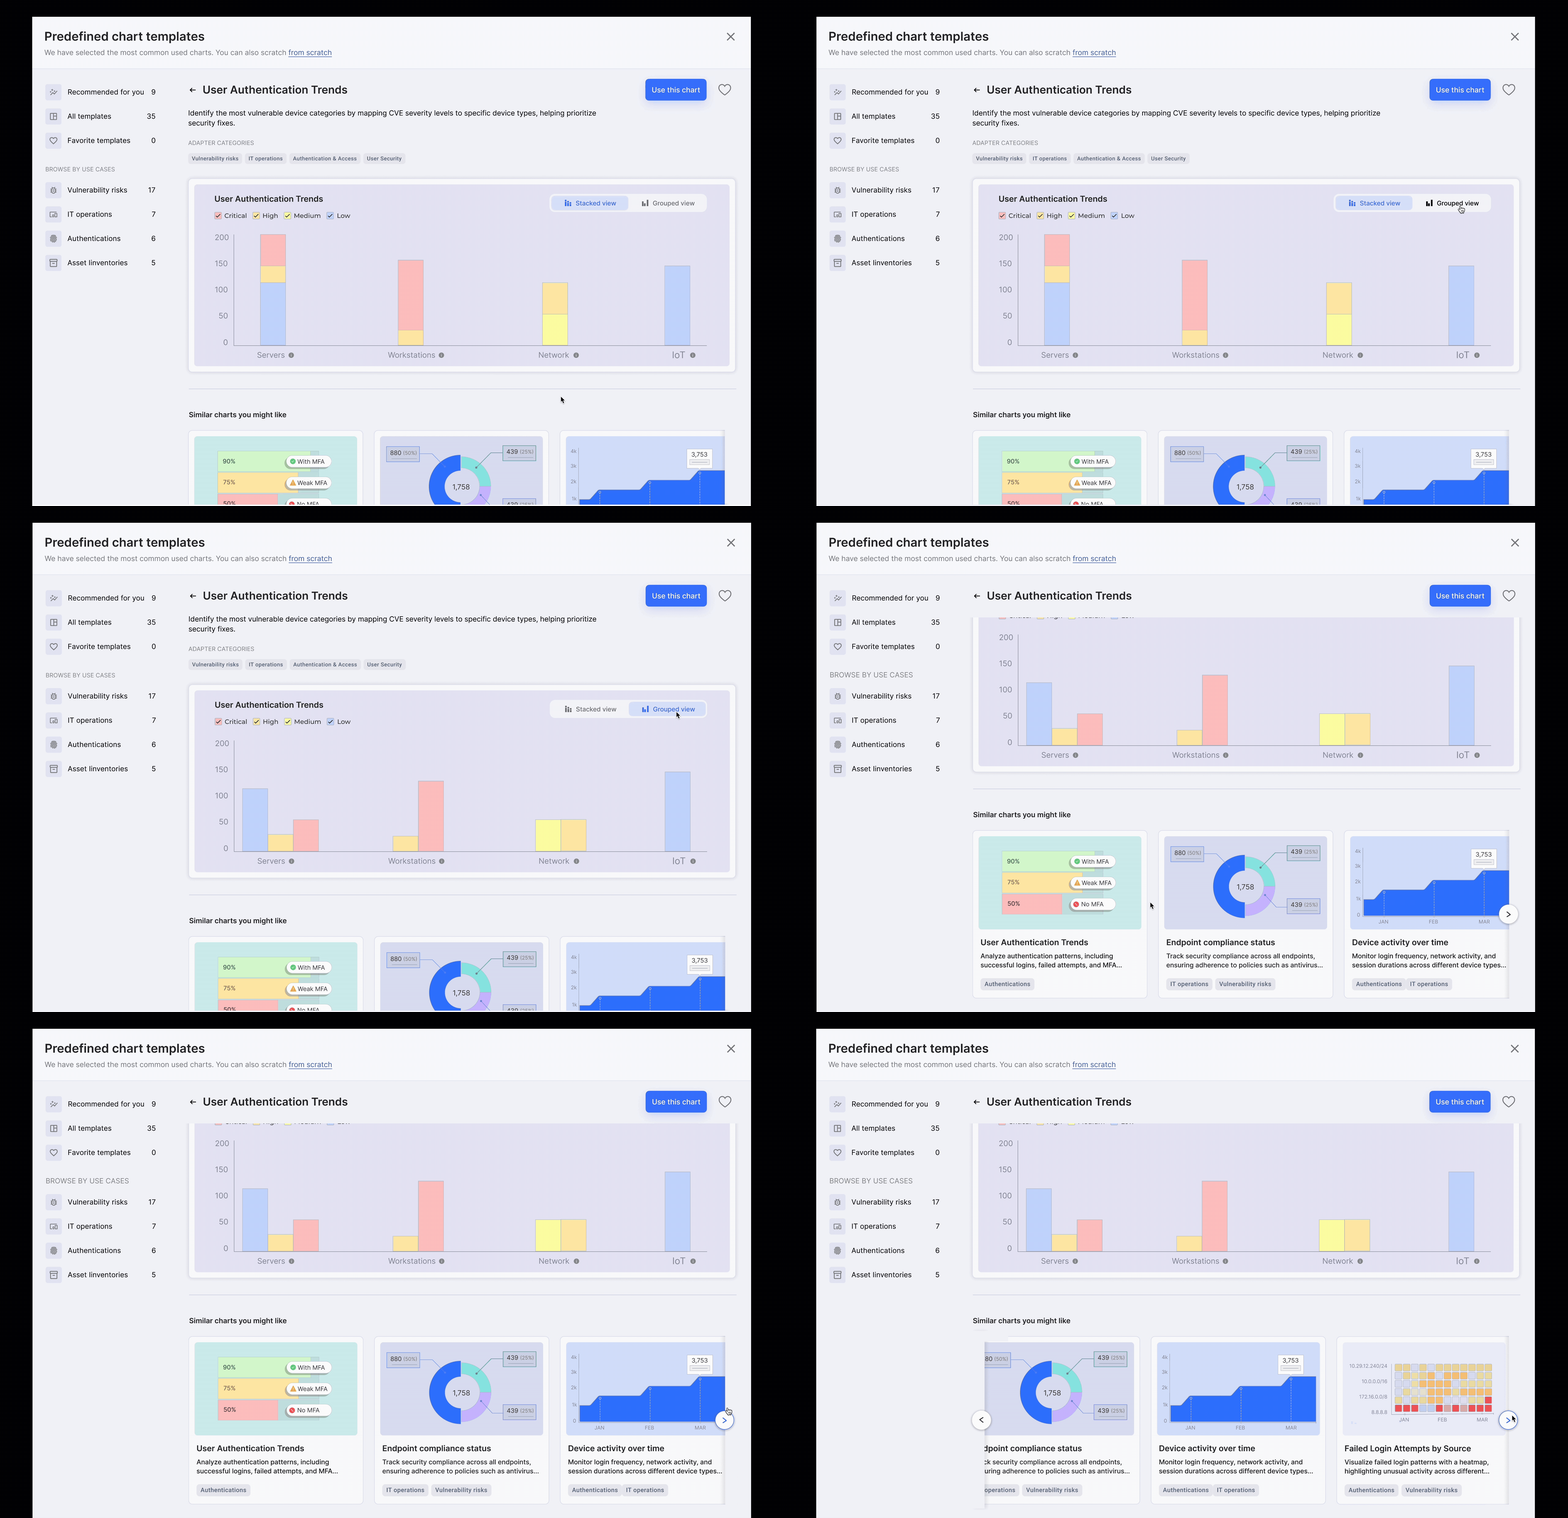
Seamless Chart Exploration
Inspired by B2C patterns users can switch chart types, show and hide values, and explore similar charts in a linear flow.
This experience cut decision making time by 30% and brought consumer grade simplicity into a B2B context.
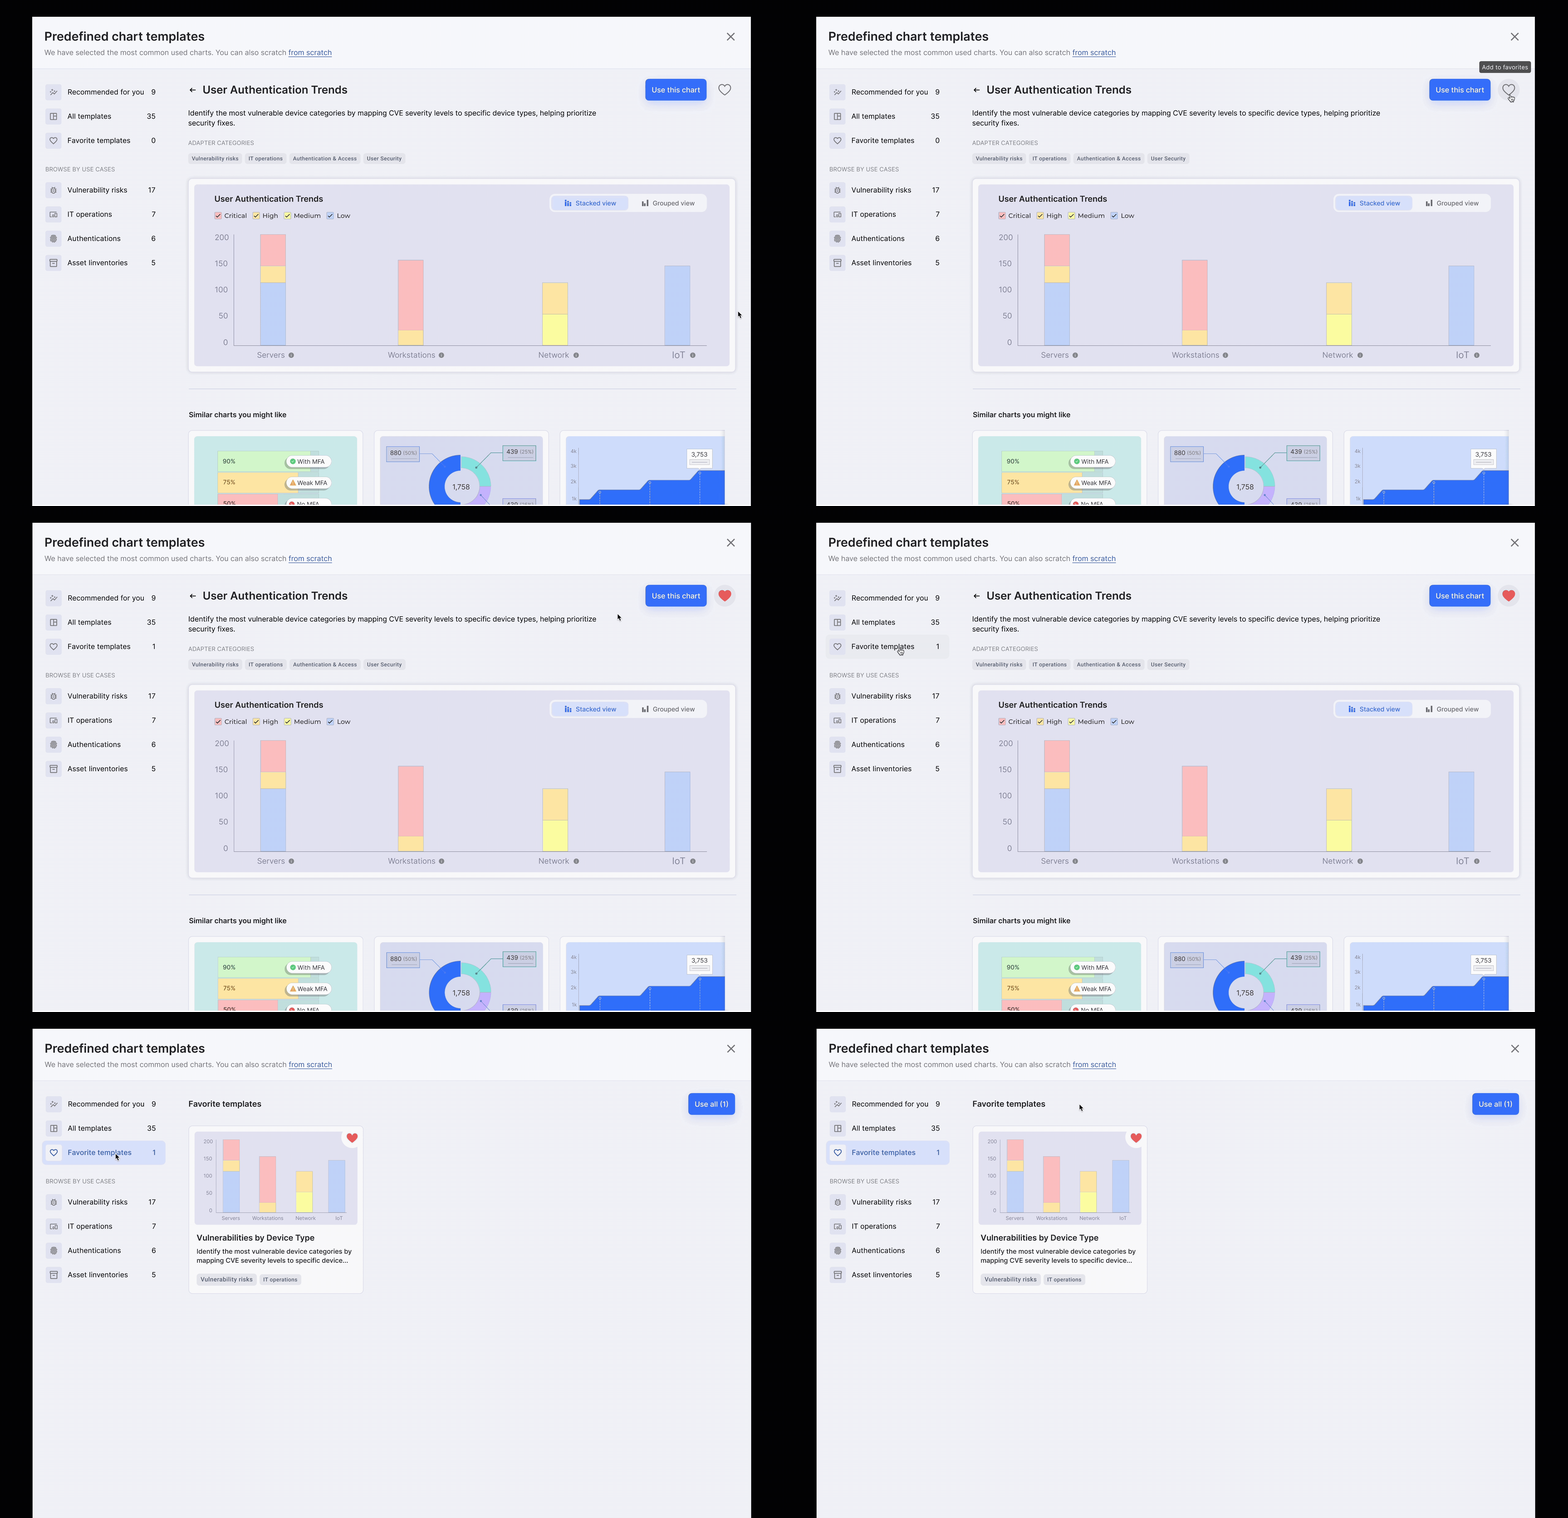
Favorites
Save key charts to a favorites category and select multiple at once to assemble dashboards faster, reducing repetitive work.
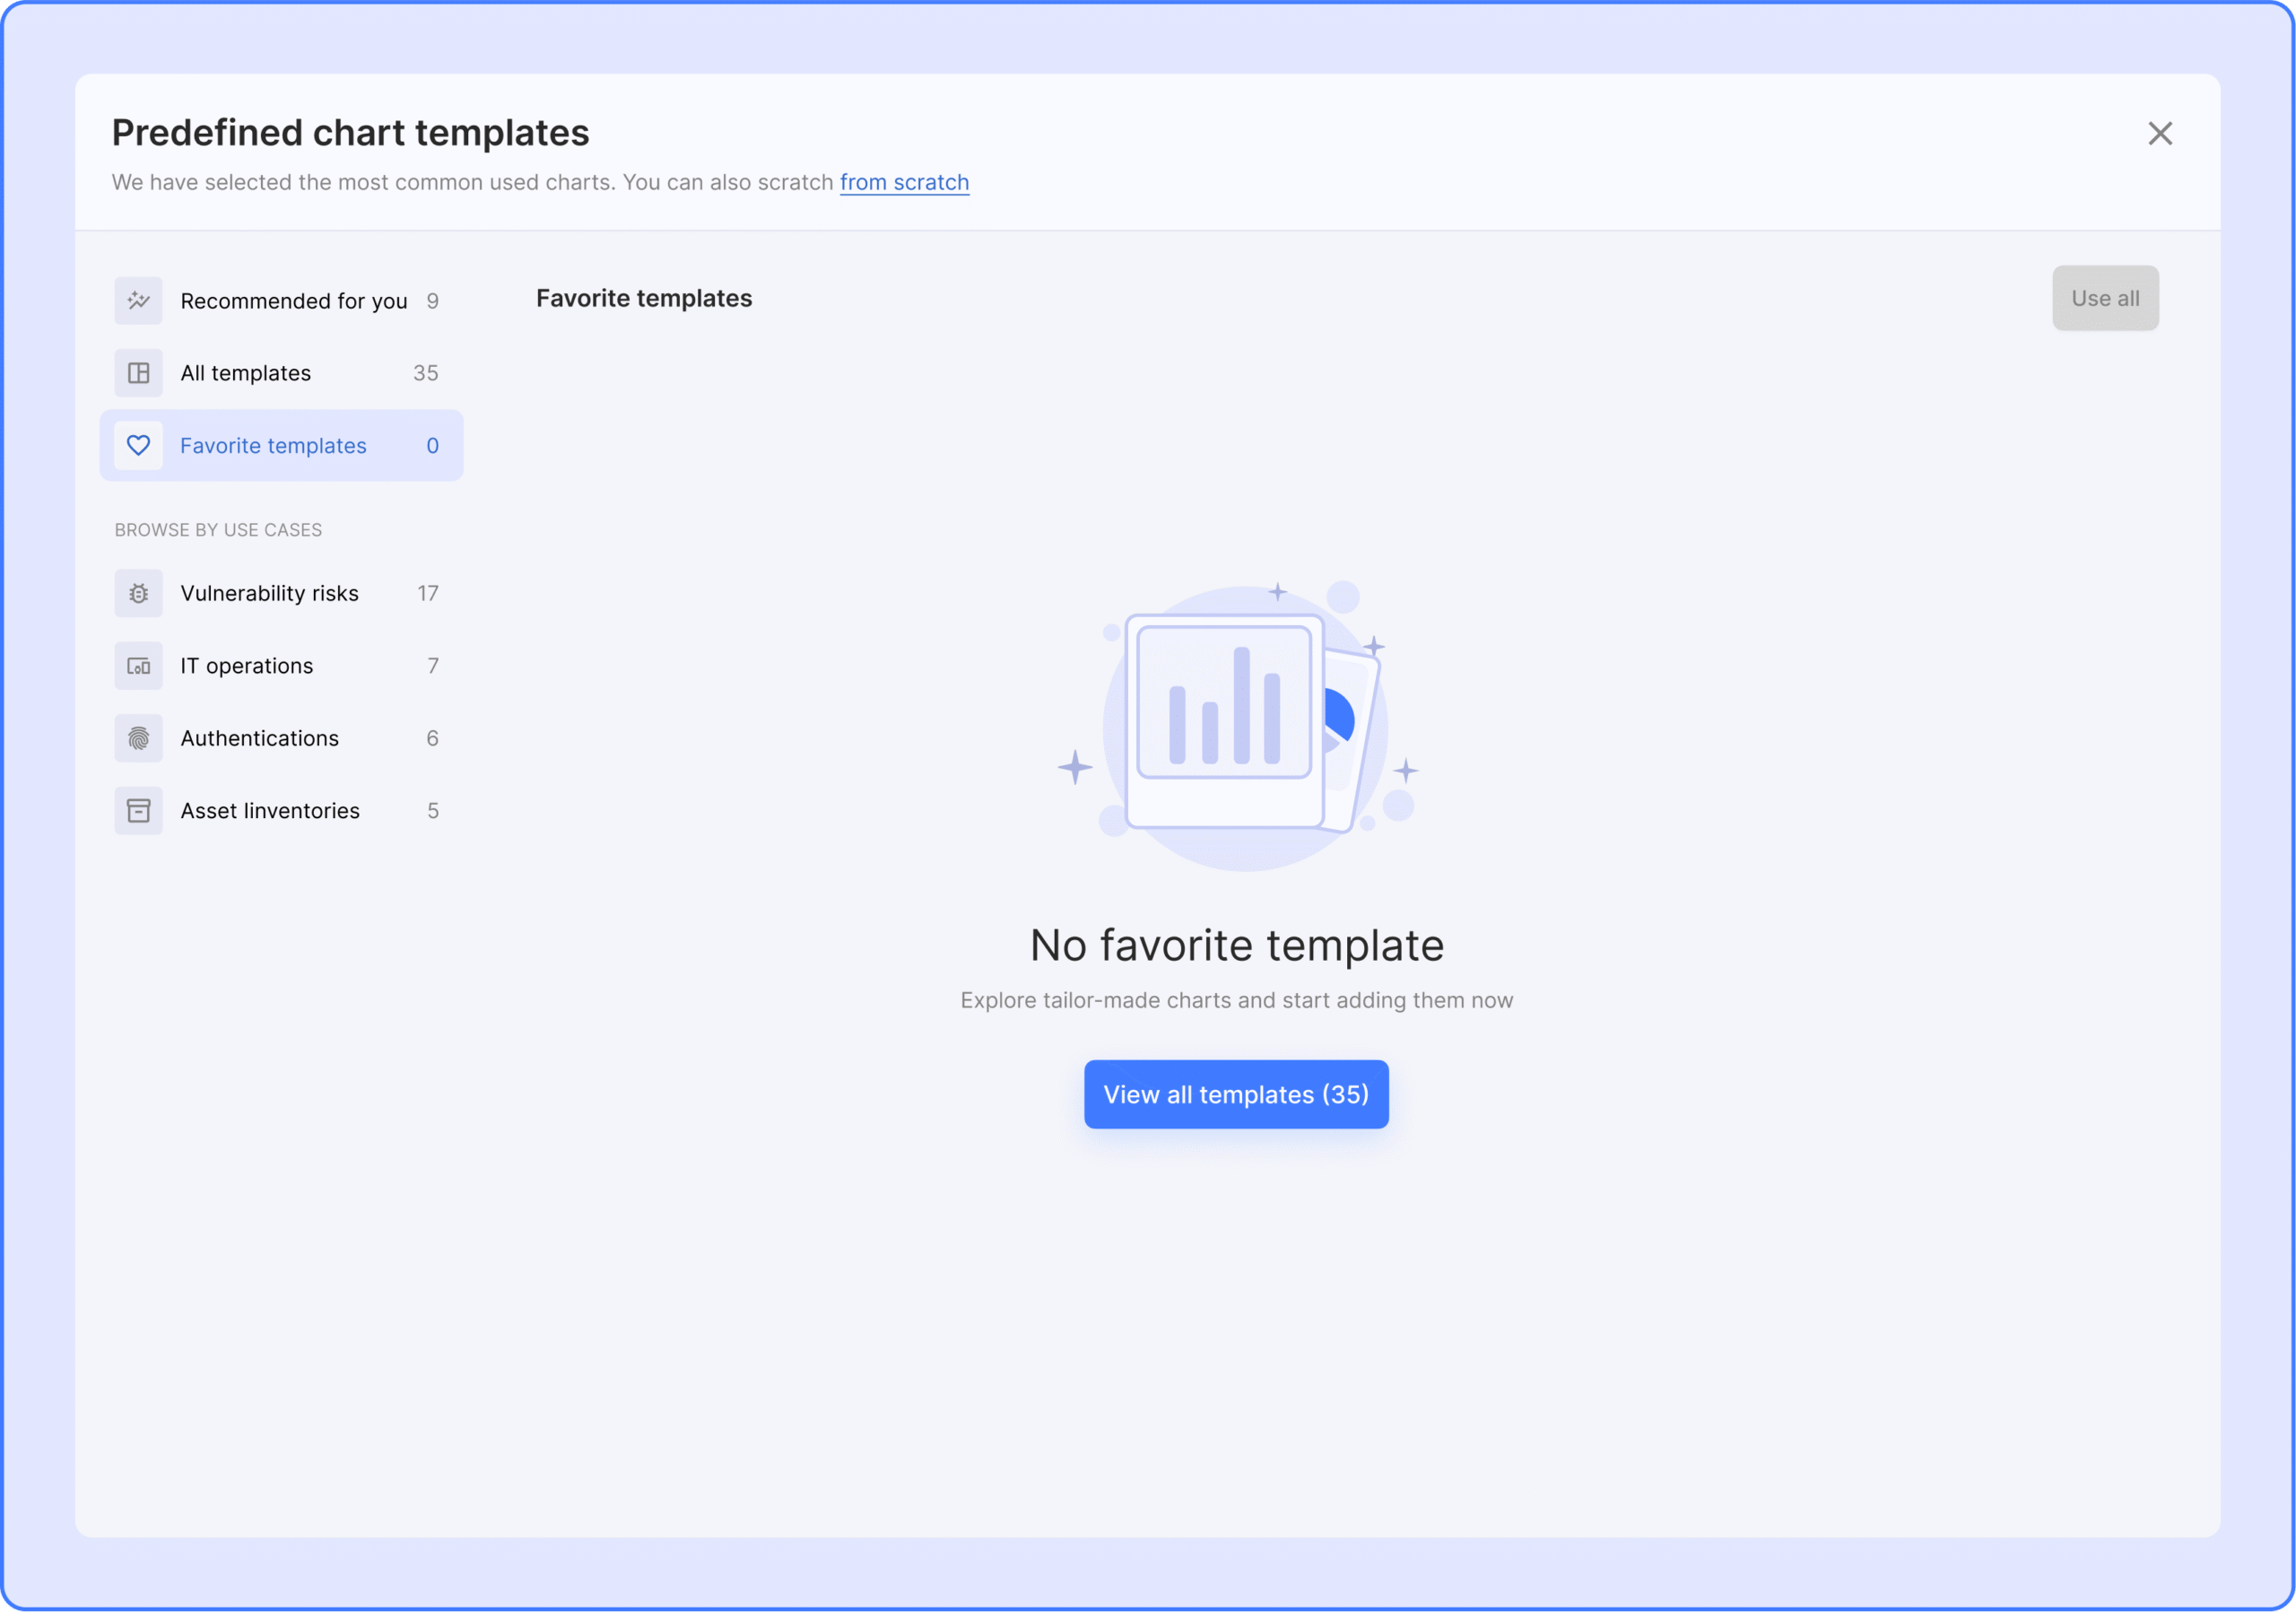
Encouraging Action with Empty States
To guide first-time users, I designed clear empty states for the Favorites section. These empty states provide context and gentle prompts, encouraging users to take action while exploring the chart selection wizard.
Favorites / Bulk Selection iteration
I conducted usability testing on the below iteration, where users could select multiple charts directly on hover using checkboxes. Testing revealed that this approach was not intuitive enough, leading to a redesign for clearer bulk selection and improved favorites functionality.

IMPACT
Key Metrics Highlighting Efficiency Gains and User Engagement
🚀 Results as follows:
 80% reduction in onboarding
From 20 minutes to 5
💖 40% use the "favorites"
Speed up the flow and tailor it to each user
📨 0 support tickets
for query setup

